Increasing Interactions with Nature: A Survey of Expectations on a University Campus
by André K. Faul
Department of Biology, University of Namibia, Private Bag 13301, Windhoek, Namibia.
Abstract
In the last century, urban biodiversity has come under increasing pressure due to urbanization and consequent habitat destruction. Land-use patterns in the Cape Floristic Region of South Africa provide a strong example of this, and research has shown alarming decreases in natural vegetation cover there. Urban greening projects can play a vital role in conservation of biodiversity in the Cape Floristic region while simultaneously providing local people with an improved living and working environment (Cornelis and Hermy 2004). This article investigates the general attitudes of a sampled demographic in the city of Cape Town on the value of urban nature. I conducted a survey of personnel and students at the Faculty of Health Sciences of the University of Stellenbosch covering issues such as spare time utilization on campus and opinions and expectations regarding their study and work environments. Results showed that the overwhelming majority of respondents believe that their study and work environments need improvement, specifically as regards gardens and the natural environment. Furthermore, respondents indicated that should the school's gardens and natural environment be improved, their own attitudes toward their work and studies would improve. From the results of this study it is plausible to assume that the general urban public is in favor of urban greening projects, and this can, together with the input of conservation biologists, promote biodiversity conservation in densely populated areas.
Keywords: Biodiversity enhancement, fynbos, restoration ecology, urban biodiversity, urban greening, urbanization
Introduction
Abram (1997) is of the opinion that "nature…has become simply a stock of resources for human civilisation." It does indeed appear that for many potential key role players, from the individual landowner to highly structured government departments, conservation is of less importance than economic growth and development (Carlson 2005). This seems to be especially true in the urban setting, where development and urban growth take place at an increasing rate and the productive, cultural, recreational, educational, and conservation value of pristine land (cf. Jacobs 1999) may no longer be reason enough to conserve the associated biodiversity. Conservationists must constantly introduce new ideas and concepts in order to convince decision-makers to take the preservation of biodiversity into consideration when new areas are developed (Primack 2000).
One potentially fruitful method of convincing decision-makers of the importance of conservation within the urban setting would be to focus more attention on the positive effects that well protected and managed elements of a natural environment (e.g., trees, birds, insects, and plants) can have on the moods of their employees, students, or colleagues (Schoeman 1955; Abram 1997). Many public and private industries worldwide have accepted the importance of ergonomics—the study that aims to find the optimum conditions under which to achieve maximum productivity and work satisfaction (Bridger 2003)—for securing satisfying work and life conditions for their employees. However, until recently, the main factors considered by ergonomics were limited to the immediate environment, for example optimum temperature, light conditions, and noise levels within the office environment. Whether the natural environment (i.e., vegetation and associated biodiversity) influences an individual's work efficiency and performance in the same way that established ergonomic factors do needs to be investigated, as literature in this field is very scarce. Studies that partially relate to this line of research include Fredrickson and Anderson (1999), Hartig et al. (1999), Herzog and Barnes (1999), and Kerr and Tacon (1999).
Click image to enlarge
Figure 1: The effect of an individual's surroundings on his or her attitude and the consequences for work efficiency. The diagram shows that negative stimuli result in a negative attitude or lack of spirituality, and positive stimuli result in a positive attitude or heightened spirituality.
The sensory experience (i.e., sound, sight, smell, and tactility) of one's immediate environment may take place unconsciously or deliberately, and it plays an important part in shaping a person's being and future (Hiss 1990). Even the way in which a person performs normal tasks is influenced by his or her physical and sensory surroundings (Schoeman 1955; Hiss 1990). This is exemplified by cases where poor working conditions cause low morale among workers, in contrast to cases where optimum working conditions result in higher productivity and a more positive attitude toward the work (cf. Edwards and Torcellini 2002; Heschong et al. 2002). Factors such as temperature, light, smell, noise, and the natural environment all help determine whether work conditions are valued as poor or good. In the same way that ergonomics can improve human effectiveness and enhance the quality of life in the work or home environment (Sanders and McCormick 1987), so unspoiled, well-managed natural environments can contribute to one's positive perception of a place and to an overall positive attitude (Hartig et al. 1991; Hartig et al. 1996; Hartig et al. 1999). A positive attitude toward the work environment could then directly influence the level of effectiveness in the work place (Norsworthy and Zabala 1985; Ries et al. 2006)(Figure 1).
Urban greening and nature conservation within urban areas has grown into an important consideration for ecologists, naturalists, and landscape designers since the early 1980s (Goode 1989), and urban green areas are now increasingly seen as an integral and important aspect of the urban ecosystem (Goode 1989; Li et al. 2005; Nilsson et al. 2007). The motives for implementing urban greening projects vary to a great degree, but mainly aim to meet social needs by allowing more frequent and readily available interaction with the natural environment and to balance infrastructure development with available urban green space (Geist and Galatowitsch 1999; Skärbäck 2007).
Urban greening has not been undertaken as widely in southern Africa as it has been in other parts of the world. Few attempts have been made to investigate and implement urban greening projects in South Africa (cf. Addo et al. 2000, Donaldson-Selby et al. 2007). In this study, I investigated the expectations of local people regarding conservation-based urban greening projects in an urban setting in South Africa by conducting a survey of students and employees of the Faculty of Health Sciences of the University of Stellenbosch, which is located on the Tygerberg Medical Campus (TMC) in the city of Cape Town. The aim of the survey was to gather information about respondents' opinions and expectations regarding their immediate natural environment surrounding the buildings on the campus. The results of the survey indicate that an attempt to promote biodiversity enhancement through urban greening on campus would be met by support from major stakeholders on the campus.
As a follow-up to the current study, I will use the data gathered to develop a rehabilitation and biodiversity-enhancement project as well as a functional management plan for the TMC. Thus, the project's developers can aim to achieve and maintain higher levels of wildlife biodiversity while taking into account the expectations of the campus populace.
Click image to enlarge
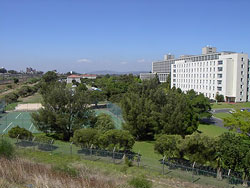
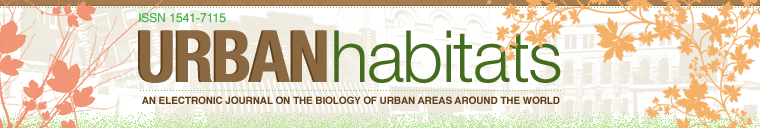
Figure 2: The Tygerberg Medical Campus (TMC) garden areas with the buildings in the background.
Click image to enlarge
Figure 3: The open areas and sports grounds on the western side of the Tygerberg Medical Campus.
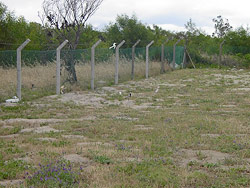
Image 1: This image depicts the difference between the mowed areas on campus and the neighboring railway grounds.
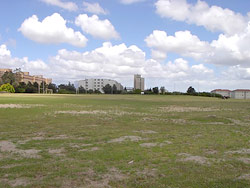
Image 2: This image depicts the sports grounds and other open areas on campus that are kept neat by mowing.
The Study Site
The Tygerberg Medical Campus in the Faculty of Health Sciences of the University of Stellenbosch is situated in the city of Cape Town, which lies in the Cape Floral Kingdom, one of the richest floral kingdoms in the world (Bond and Goldblatt 1984). With just under 1000 administrative and academic staff members and more than 2000 students, the TMC's population represents a broad demographic spectrum. Members of this population have different needs and expectations of their environment, and are active in their interpretations and evaluation of the environment (cf. Churchman 2002). Thus, given the different backgrounds and roles of the various members of the TMC, it is highly likely that they hold a wide range of ideas, opinions, and expectations about global conservation issues, their immediate environment, and the appearance of the campus.
The site was selected following an expression of interest by the management of the faculty to improve the vegetation and overall biodiversity of the campus. The campus of approximately 26 hectares is situated next to the Tygerberg State Hospital, and together they cover a large area in the form of concrete buildings, parking lots, and tarred roads (Figure 2). The Tygerberg State Hospital works closely with the Faculty of Health Sciences, but they are under different management. The main vegetation on the campus consists of lawns and trees, of which a large proportion of species is nonnative. Very little other vegetation occurs on the campus, and where remnants of vegetation do occur, they are controlled through regular mowing. In addition to the above-mentioned facilities, sports grounds cover a significant area of the campus (Figure 3).
Methods and Materials
Although the campus is rich in vegetation when compared to nearby industries and office complexes, it seems that students and personnel perceive the Tygerberg Medical Campus as dull in comparison to the main campus of the University, also situated in Stellenbosch. This study aims to establish (1) whether this perception represents the general attitude of students and personnel, and (2) whether the need exists to see an improvement in this respect. Information will also be gathered on what the students and personnel expect from improvements of the premises. Furthermore, respondents will be given an opportunity to state whether they think that an improved work environment will have a positive effect on their efficiency and attitude.
To establish the current opinions and expectations of personnel and students on the campus, a survey was conducted. Two questionnaires were designed: one for personnel and one for students. The questionnaire was printed in both English and Afrikaans, the two main languages spoken on the campus. The questionnaire designed for personnel (cf. Appendix A) was handed out to 750 administrative and academic staff members on 15 October 2003 with the request that completed questionnaires be returned to a specified office.
The questionnaire designed for students (cf. Appendix B) was handed out to 600 students in all the different disciplines (medicine, physiotherapy, dentistry, etc.) of the faculty, ranging from the second to the final (sixth) academic year, during the registration period on 16 and 19 January 2004. By combining the completion of the questionnaires with the registration process, I reached a significant proportion of the student population and anticipated a large return percentage.
Contents of the Questionnaires
The two questionnaires contained mostly the same questions, but in certain categories questions were tailored to be relevant to the respective groups (e.g., student questionnaires included an extra section regarding their residency).
Analysis
I assigned coded values to all questionnaire answers (see Appendix A and B for coding) and entered these values into a Microsoft Excel spreadsheet. The following sections were specifically coded to get a collective value indicating the respondent's opinion on that section.
Opinion of Nature
I coded answers in this section in such a way that a negative answer was given the lowest value (i.e., 1), while the most positive answer was assigned the highest value (i.e., 3 or higher, depending on the range of possible answers). Then, I added together the coded values allocated to each of the selected complements to the four half statements, resulting in a value ranging from four to thirteen. I then adjusted this value to a final score out of ten. The final score represents an indication of each respondent's opinion value of nature, where 1 represents the lowest possible opinion of nature and 10 the highest possible opinion of nature. In this valuation, the secondary question in question 1 of this section, in which respondents had to respond whether they viewed nature as important or crucial, was not taken into account as too few respondents answered the question.
Campus Appearance
The same method was applied to the first three questions of this section. The answers were coded so that the most negative answer was allocated the lowest value and the most positive answer the highest. The coded values were then added to get an impression value ranging from 3 to 14, which was consequently adjusted to range from 1 to 12, with 1 showing a very negative impression value of the campus and 12 representing the most positive impression value.
I tested all the questions in this section for statistically significant differences between the possible answers by performing a chi-square test in Microsoft Excel. Furthermore, specific questions directed to both students and personnel were also tested for any significant differences between these two groups. In cases where a respondent did not answer the question at all, resulting in a zero value in the chi-square test (i.e., a divided by 0 error occurred in the analysis), the 0 was replaced by 0.5.
Click image to enlarge
Figure 4: Graph representing, as a percentage, the opinion value of respondents regarding nature. Both students and personnel show a significant positive that averages 9 (students: Χ2 = 1118.55, df = 9, p < 0.05), personnel: Χ2 = 549, df = 9, p < 0.05). Personnel places a significantly higher value on nature than students (Χ2 = 20.75, df = 9, p < 0.05).
Results
A very good response by personnel was achieved, with a return of 196 (28%) completed questionnaires out of 750 questionnaires issued. Of these, 55 (28%) were completed by male respondents and 141 (72%) by female respondents. Distributing questionnaires among students during registration resulted in the exceptionally high return of 568 (97%) out of the 600 questionnaires issued. Of these, 158 (28%) were completed by male respondents and 410 (72%) by female respondents. The following results for students and personnel and comparisons between students and personnel were generated:
Opinion of Nature
The opinion value of students and personnel regarding nature reveals that both groups places very high value on nature (students: Χ2 = 1118.55, df =9, p < 0.05; personnel: Χ2 = 549, df = 9, p < 0.05) (Figure 4). The difference in values placed on nature is statistically significant between students and personnel (Χ2 = 20.75, df = 9, p < 0.05), with personnel placing a higher value on nature than students.
Click image to enlarge
Figure 5a: Figure representing, as a percentage, student choice of place for spending any available spare time while on campus. The most significant proportion prefer spending time in the Student Centre (Χ2 = 54.41, df= 3, p < 0.05).
Click image to enlarge
Figure 5b: Figure representing, as a percentage, personnel choice of place for spending lunch time. The majority of personnel (66%) prefer spending their time indoors on campus (Χ2 = 167.11, df = 3, p < 0.05), while the remaining 34% either go off campus, stay outdoors, or do something else.
Click image to enlarge
Figure 5c: Graph representing as a percentage the reasons why respondents take walks on campus. A significant difference exists between the reasons of students and those of personnel for walking on campus (Χ2 = 92.81, df = 4, p < 0.05). Apart from walking to class and back, students walk on campus mainly while having discussions with friends or other students, while the smallest group walk to enjoy nature (Χ2 = 213.27, df = 4, p < 0.05). Personnel, on the other hand, mainly walk on campus in order to enjoy nature and are the least likely to walk while taking time for private contemplation (Χ2 = 14.70, df = 4, p < 0.05).
Click image to enlarge
Figure 5d: Graph representing as a percentage the reasons why respondents are reluctant to take walks on campus. The main reasons why students and personnel don't walk on campus are the lack of things to enjoy while walking and the lack of time to take walks (students: Χ2 = 188.90, df = 3, p < 0.05, personnel: Χ2 = 73.91, df = 3, p < 0.05).
Click image to enlarge
Figure 6a: The impression value of students and personnel regarding the Tygerberg Medical Campus appearance. Data for both students and personnel suggest a statistically significant tendency for respondents to have an average impression value (students: Χ2 = 399.4, df = 11, p < 0.05; personnel Χ2 = 205.13, df = 11, p < 0.05). There is also a significant difference between the impression values of students and personnel (Χ2 = 25.37, df = 11, p < 0.05), with students having a slightly lower impression value than personnel.
Click image to enlarge
Figure 6b: The areas or items on campus that respondents would like to see improved in appearance. Gardens and natural vegetation are the two areas that they feel need the most improvement (students: Χ2 = 380.24, df = 3, p < 0.05; personnel: Χ2 = 123.65, df = 3, p < 0.05). There was no significant difference between student and personnel data.
Click image to enlarge
Figure 7a: Respondents' level of agreement with the statement that if natural vegetation and bird and animal life were improved on campus, they would spend more of their spare time on campus than in the past. A significant proportion agreed to this (students: Χ2 = 446.76, df = 3, p < 0.05; personnel: Χ2 = 173.84, df = 3, p < 0.05).
Click image to enlarge
Figure 7b: Student and personnel attitudes toward the campus. A larger proportion of students felt that their attitude toward the campus and their work would improve if the natural vegetation and bird and animal life were improved (Χ2 = 20.58, df = 3, p < 0.05).
Click image to enlarge
Figure 7c: The percentage of support students and personnel give to suggested improvements on campus. There are statistically significant differences between the options they support (Students: Χ2 = 331.19, df = 5, p < 0.05; Personnel: Χ2 = 92.39, df = 5, p < 0.05) and significant differences between the options supported by students and the options supported by personnel (Χ2 = 55.42, df = 3, p < 0.05).
Spare Time Utilization
During a normal weekday, 82% of students prefer to spend spare time off campus (Χ2 = 233.09, df = 1, p < 0.05). When they do spend spare time on campus, 22.7% remain indoors or visit a residence; the majority (38.8%) visit the Tygerberg Student Centre and the second largest number (25.6%) partake in some form of sport. Only 12.7% indicated that they choose to go outside to enjoy nature on the campus (Χ2 = 54.41, df = 3, p < 0.05) (Figure 5a).
In Figure 5b it is clear that during lunch time, the majority of personnel on campus (66%) prefer spending their time indoors (Χ2 = 167.11, df = 3, p < 0.05), with the remaining 34% either leaving campus, staying outdoors (i.e. utilizing the natural environment to some extent), or engaging in other activities. Only 10.4% of personnel indicated that when they have spare time in addition to their lunch break on campus, they regularly take walks, while 48.4% indicated that they seldom take walks on campus and 41% indicated that they never take walks (Χ2 = 46.91, df = 2, p < 0.05).
Figure 5c shows that a significant difference exists between the reasons given by students and those given by personnel for taking walks on campus (Χ2 = 92.81, df = 4, p < 0.05). Apart from walking to and from class, students walk on campus mainly while in conversation with friends or other students, while the smallest group of respondents walk to enjoy nature (Χ2 = 213.27, df = 4, p < 0.05). Personnel, on the other hand, walk on campus mainly in order to enjoy nature and are least likely to walk to undertake private contemplation (Χ2 = 14.70, df = 4, p < 0.05).
The main reasons given by students and personnel for not walking on campus are the lack of features to enjoy while walking and the lack of time to take walks (students: Χ2 = 188.90, df = 3, p < 0.05; personnel: Χ2 = 73.91, df = 3, p < 0.05) (Figure 5d).
Campus Appearance
The impression value of students and personnel is a representation of their thoughts and attitudes regarding the physical appearance of the campus. Data for both students and personnel suggest an average impression value for both groups (students: Χ2 = 399.4, df = 11, p < 0.05; personnel: Χ2 = 205.13, df = 11, p < 0.05) (Figure 6a). There is also a significant difference between the impression values of students and those of personnel (Χ2 = 25.37, df = 11, p < 0.05), with students showing a slightly lower impression value than personnel.
Students and personnel each indicated specific areas or features on campus that they would like to see receive an improved appearance. Gardens and natural vegetation are the two areas that both groups feel need the most improvement (students: Χ2 = 380.24, df = 3, p < 0.05; personnel: Χ2 = 123.65, df = 3, p < 0.05) (Figure 6b). There was no significant difference between student and personnel data for this question.
Campus Improvements
Both students and personnel agreed that if natural vegetation and bird and animal life were improved on campus, they would spend more spare time outdoors on campus than in the past (students: Χ2 = 446.76, df = 3, p < 0.05; personnel: Χ2 = 173.84, df = 3, p < 0.05) (see Figure 7a). Both groups believed that their attitude toward the campus and their work would improve, if natural vegetation and bird and animal life were improved (students: Χ2 = 536.45, df = 3, p < 0.05; personnel: Χ2 = 101.05, df = 3, p < 0.05) (Figure 7b). Furthermore, a larger proportion of students felt this way than personnel (Χ2 = 20.58, df = 3, p < 0.05).
The majority of students (94%) and personnel (97%) support the creation of natural vegetation corridors linking the campus with other natural vegetation areas (students: Χ2 = 432.99, df = 3, p < 0.05; personnel: Χ2 = 173.52, df = 3, p < 0.05). Figure 7c shows the extent of support students and personnel give to suggested improvements on campus. There are statistically significant differences between the options they support (students: Χ2 = 331.19, df = 5, p < 0.05; personnel: Χ2 = 92.39, df = 5, p < 0.05) and significant differences between the options supported by students and those supported by personnel (Χ2 = 55.42, df = 3, p < 0.05).
Additional Commentary
In addition to answering the survey's questions, some respondents wrote supplemental commentary on the questionnaires. A total of 123 students and 65 staff members gave additional commentary. The most frequent suggestions are listed as follows, with the numbers in brackets indicating the number of respondents who made these suggestions:
- Plant more trees (31)
- Add benches and tables (18)
- Plant more indigenous vegetation (14)
- Create a water feature (11)
- Create animal and bird refuges (10)
Questionnaire Return
The high return of completed questionnaires by personnel and students could be an indication of the level of priority with which they regard the issue at hand. According to the Faculty administration, the return rate of 28% by personnel was much higher than their usual return for reponses about financial and administrative matters at the University. The very high return by students was in part a result of the timing of the distribution of the questionnaires. As this took place at the beginning of the academic year, students were subjected to fewer time constraints and as they were asked to complete the questionnaires during the registration process, all students were easily targeted. Students were given the option of completing the questionnaires at a later time; nevertheless, most of them, when informed of the nature of the questionnaire, were more than willing to complete it immediately. The significantly higher return by female respondents could most likely be related to the proportion of female and male personnel and students employed by and enrolled at the University.
Questionnaire Results
Opinion of Nature
The general opinion of respondents regarding the environment was very positive. They see it as an important, if not integral, part of human life that has to be protected. It follows that the students would generally be in favor of environmentally positive propositions on campus. It is possible that, given the academic nature of the institution, the importance respondents attach to nature is related to their level of academic development. If this is true, further studies should be conducted to distinguish between the diverse views respondents with different academic backgrounds will express regarding nature. This will also determine the approach to be used when dealing with other sectors of society about conservation issues.
A higher opinion value among personnel, when compared to that of students, may be an indication of the level of responsibility exhibited by each of the groups. In general, it is assumed that students take less responsibility for external concerns than people who have responsibilities to answer to, e.g., careers and families. It may therefore follow that students in general feel less responsible toward issues regarding nature. Kaiser and Shimoda (1999) have shown that moral and conventional responsibility play a role in a person's ecological behavior.
Spare Time Utilization
The high number of students who prefer spending spare time either off campus or indoors, coupled with the small percentage that spend time outdoors, is an indication of the impression that they seem to have of the campus environment. Individuals will be less likely to spend time outdoors if no stimulating experience occurs there. Personnel also spend most of their spare time indoors during a normal working day, with only 10% taking regular walks on the campus. This tendency to stay indoors or to leave the campus whenever respondents have spare time is consistent with a lack of stimulation (in the form of activities, scenery, or recreation) on campus. This is supported by the respondents' impression values regarding the appearance of the campus (Figure 6a).
In cases where students do walk on campus, they do so mainly while in conversation with friends or other students. They are least likely to walk while enjoying the natural aspects of the campus. Personnel, on the other hand, walk mainly to enjoy the natural aspects of the campus. As the respondents are from an academic institution where work requires a lot of their time, it is not surprising that the main reason both students and personnel give for not taking walks on campus is a lack of spare time. Furthermore, there are more spare time activities for students than for personnel. On campus, students can participate in sports, visit friends, stay in their residences, or go to the Tygerberg Student Centre. Personnel, on the other hand, can only stay in their offices, leave campus (time permitting) or take walks on campus. This explains why personnel are more likely to walk on the campus in their spare time. However, this does not suggest that personnel find the natural aspects of the campus to be adequately entertaining while walking.
Campus Appearance
The physical conditions of any work environment play an important role in employee happiness and work satisfaction. Physical conditions can include aspects such as office ergonomics and physical and natural appearances. Respondents at the TMC rate the impression value of the campus as slightly below average, with students generally rating it lower than personnel. A possible reason for this phenomenon could be that 59% of the student respondents reside on the campus, coupled with the assumption that individuals seem to place a higher premium on and therefore show higher expectations of their living environment than their working environment. Both students and personnel feel that gardens and natural vegetation are the two areas that need most improvement. Should these areas be improved, it is expected that the impression value of both students and personnel will increase significantly.
Campus Improvements
Respondents agree that they would spend more of their spare time on campus if the natural vegetation and bird and animal life of the campus were improved. They also feel that should this happen, their attitude toward the campus and their work would improve. This opinion is stronger among students than among personnel, which could again be explained by the fact that students reside on campus. The general opinion of respondents (i.e., that their attitude toward the campus and their work would improve and that they would spend more time on the campus should the campus environment be improved) supports findings that one's mood is affected by the qualities of one's surroundings and that entering different environments can alter one's mental state or mood (Apter 1982, 1989; Russell and Snodgrass 1987). This was shown by experiments using photographic environmental simulations, in which natural settings have been found to alter emotions positively, while urban settings seem to create negative emotions (Hartig et al. 1991, 1996, 1999). These findings could be used as leverage in attempts to convince other institutions to improve and manage their natural surroundings. The argument would be that in return for their investment, the institutions are likely to witness higher levels of work satisfaction and higher efficiency in staff.
An overwhelming proportion of respondents (94% of students and 97% of personnel) support the proposal to establish natural vegetation corridors between the TMC and other natural vegetation areas. Their support for the proposed enhancements on campus (e.g. the establishment of footpaths, benches, rest areas, water features, and the reintroduction of fynbos) can be utilized in the development of a management plan for the enhancement of biodiversity on the campus.
Discussion
It is clear from this study that the individuals and groups working and studying at the TMC have specific expectations regarding their living and working environment. They also seem to be very particular about what they would like to see improved there. The general sentiment among respondents is that improvements in the gardens, followed closely by improvement in the general natural surroundings, would improve their attitude toward the campus and their work/study environment. This is supported by previous studies on urban greening and urban nature conservation (cf. Goode 1989; Geist and Galatowitsch 1999). One can therefore assume that urban greening is very likely to improve the respondents' work efficiency and willingness to perform tasks to the best of their ability. One would expect that these findings at the TMC might also be indicative of respondent reactions in other sectors of society. To verify this, similar studies should be performed in the industrial and business sectors. Should these sectors show similar responses, conservation biologists would gain an argument to use in support of well-designed biodiversity enhancement projects. By including the participation of local people in the design and execution of such projects, they will also increase the success achieved, as indicated by Goode (1989).
Arrow et al. (1993) suggest that when the value a person places on nature is determined, one should ask what monetary value he or she is willing to attach to access to a natural environment, and not merely what he or she is willing to accept without committing his or her own financial or material resources. This would reflect a more accurate expression of a person's willingness to use his or her own resources to conserve and protect nature. Within this framework, the results of the survey in this study cannot necessarily be regarded as a true reflection of the willingness of respondents to contribute in full to environmental conservation. Respondents were seemingly eager to suggest improvements to their immediate environment, but whether they would actively participate in a project to bring about the suggested improvements remains to be seen.
It is clear from the outcome of this survey that people seek increased interaction with nature in their everyday environment. Conservationists should utilize this need in order to convince authorities to spend more time and effort on ensuring the natural well-being of the urban environment, even within the most densely developed cities. However, further investigations need to be carried out in order to truly understand the influence that urban nature has on society. The effect of nature on the productivity and general well-being of employees in the work environment needs to be tested and the influence of restored environments on humans determined. Furthermore, this study also provides evidence of the need to involve local people in urban greening projects.
It has now become the task of conservationists to convince society to make investments in the protection of earth's remaining natural habitats and to promote their restoration and management. One way to achieve this would be to promote the human benefits that result from interacting with a richly biodiverse area in one's immediate surroundings, which has been shown to strongly affect emotions, attitude, and mental abilities (Fredrickson and Anderson 1999; Hartig et al. 1999; Herzog and Barnes 1999; Kerr and Tacon 1999). By capitalizing on these benefits, society can be motivated to put more effort into habitat restoration and management.
Acknowledgments
I am grateful to Dave Pepler, the Department of Conservation Ecology, and the Faculty of Health Sciences of the University of Stellenbosch for their support and provision of resources to conduct the research for this study. I would also like to thank the following institutions: the Namibian Government, the Africa-America Institute, and the University of Namibia for their financial support for the duration of the study.