
Herpetofaunal Use of Edge and Interior Habitats in Urban Forest Remnants
by Daniel E. Dawson and Mark E. Hostetler
Department of Wildlife Ecology and Conservation, University of Florida, Gainesville, FL 32611
Abstract
While we know that reptiles and amphibians make use of urban forest remnants, little research has been conducted on whether certain species use edges and interiors of remnants to different extents. In our investigation, we used pitfall traps, funnel traps, and PVC pipe sampling arrays to survey the presence of herpetofauna in five urban forest remnants (between 3.0 and 16.6 hectares in size) in Gainesville, Florida, during the summers of 2005 and 2006. We then compared the average daily relative abundances of individual species and taxa groups (at order and suborder levels and also at the family level), as well as species richness and compositional similarity at edge locations (defined as 20 to 40 meters toward the interior from the remnant boundary) and interior locations (defined as over 40 meters from the remnant boundary). Our results showed that edge and interior locations did not differ in either the relative abundance of individual herpetofaunal species and taxa groups or species richness. In addition, our analysis of species composition showed that most remnants had very similar compositions at their edges and interiors. Furthermore, our vegetative analyses showed very few vegetative differences between edge and interior locations. Despite the lack of a difference in edge and interior habitat use by herpetofauna, a finding possibly due to a lack of difference in vegetative structure, study results did show that urban forest remnants serve as habitat to some herpetofaunal species that can tolerate conditions within small patches.
Key words: urban, herpetofauna, reptiles, amphibians, herps, edge, interior, habitat isolation, habitat use, forest remnant, habitat fragmentation
Introduction
Reptiles and amphibians face numerous challenges coexisting with an urbanizing world (Rubbo and Kiesecker 2005; McKinney 2006). Research has shown that herpetofauna can be negatively affected by the habitat isolation created by urbanization. Barriers to the dispersal of animals such as roadways (Houlahan and Findlay 2003; Ficetola and De Bernardi 2004; Cushman 2006; Parris 2006), the reduction of water and wetland quality through adjacent land use (Houlahan and Findlay 2003), and the alteration of water level and flow patterns (Richter and Azous 1995; Delis et al. 1996; Riley et al. 2005) all cause habitat degradation that particularly affects herpetofauna. Much attention has been paid to the effects of urbanization on amphibians because their need for access to water in which to breed makes their survival vulnerable to ecological alterations, and urbanization can have significant impacts on water quality (Riley et al. 2005; Rubbo and Kiesecker 2005). However, habitat fragmentation and other anthropogenic threats such as environmental pollution, over-harvesting, and the introduction of non-indigenous species put both reptiles and amphibians at substantial risk (Gibbons et al. 2000). The IUCN estimates that one third of herpetofaunal species worldwide are threatened with extinction (Baillie et al. 2004; Cushman 2006).
Urban and Edge Effects on Herpetofauna
Reptiles and amphibians can be found within forest remnants (Schlaepfer and Gavin 2001, Lehtinen et al. 2003, Urbina-Cardona et al. 2006), including fragments of forests completely surrounded by urbanization (Enge et al. 2004; Ficetola and De Bernardi 2004; Parris 2006). Habitat fragmentation, which can be caused by urbanization, creates a higher amount of edge habitat than interior habitat in urban forest remnants. Edges have long been recognized as having higher diversities and higher abundances of species than habitat interiors, particularly of game species and birds (Leopold 1933; Lay 1938; Yahner 1988). This pattern is partially due to factors such as the increased sunlight exposure and increased emergent vegetation at edges, as well as the increased abundance of invertebrates there (Murcia 1995; Harper et al. 2005). However, for herpetofauna, particularly amphibians, interior habitats generally offer cooler, moister conditions, and therefore may be more conducive to survival, particularly during dry periods (Schlaepfer and Gavin 2001; Lehtinen et al. 2003).
Past research comparing herpetofaunal use of edges and interiors of forest remnants has shown that species of herps can respond in different ways to habitat edges, and species can thus be categorized as edge-associated, interior-associated, and edge-indifferent (Schlaepfer and Gavin 2001; Lehtinen et al. 2003; Urbina-Cardona et al. 2006). These findings have varied depending upon the ecological system that was studied as well as the season in which it was studied. For example, Lehtinen et al. (2003) and Schlaepfer and Gavin (2001) found herp species to use edges and interiors of forest remnants differently within desert and pasture matrices, respectively, but these results were highly dependent upon whether it was the wet or dry season. In addition, Urbina-Cardona et al. (2006) found that groups of reptiles and amphibians used edges and interiors of remnants to differing extents within pasture matrices throughout the year, but that the variables influencing these patterns changed for the wet and dry seasons. Currently, very little is known about whether individual species or taxa groups use interior or edge areas of urban forest remnants differently.
Our objective in this study was to determine whether species and taxa groups of amphibians and reptiles use edge and interior habitats differently within urban forest remnants during the summer.
Methods
Study Site
Click image to enlarge
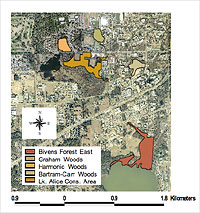
Figure 1: Forest remnants included in herpetofaunal sampling on the University of Florida campus in Gainesville, Florida.
We focused our study on five forest remnants on the University of Florida campus, located in Gainesville, Florida: Harmonic Woods (3.7 hectares); Graham Woods (3.0 hectares); Bartram-Carr Woods (3.5 hectares); Lake Alice Conservation Area (11.3 hectares); and Bivens Forest (16.6 hectares) (Figure 1). The University of Florida Gainesville campus is located in north-central peninsular Florida, where summers are hot, humid, and generally rainy. Two of the three smallest remnants, Harmonic Woods and Bartram-Carr Woods, consist mainly of upland mixed pine-hardwood forest, and both contain or are immediately adjacent to small streams or low-lying areas. The third small patch, Graham Woods, is made up of a mixture of bottomland hardwoods and upland mixed pine-hardwoods, and encloses a small network of seasonally fluctuating but permanent streams. One of the two largest remnants, Lake Alice Conservation Area, contains upland mixed pine-hardwood forest and some regenerating clear-cut habitat, and has some flood-plain forest created by a large marsh (25 hectares) adjacent to the remnant. The other large remnant, Bivens Forest, consists of an interior bottomland-hardwood swamp ringed by mixed pine-hardwood forest on three of its four edges. Its fourth edge is adjacent to a lake. All remnants except Harmonic Woods are subject to occasional flooding.
Herpetofaunal Sampling
We sampled herpetofauna from May to August during the summers of 2005 and 2006, using drift fence arrays with pitfall traps and funnel traps, along with polyvinyl chloride (PVC) pipe refugia to sample for tree frogs. We made drift fences out of approximately 30-centimeter-wide silt fencing (Enge 1997). For funnel traps, we modified the format described by Enge (1997), using aluminum window screening approximately 76 centimeters in length to build cylindrical traps of the same length with a funnel in one end and with the other end closed. Following a modification of a design by Moseley et al. (2003), we formed arrays in the shape of a Y, with three 7.6-meter-long drift fence wings conjoined around a single pitfall trap and placed at 120-degree angles to each other. We placed funnel traps at the distal ends of each wing, making sure the open funnels were flush to the ground and equally straddling the ends of the fences (Johnson, personal communication).
Click image to enlarge
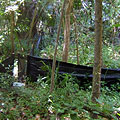
Example of herpetofaunal sampling array used during this survey. Drift fences, center pitfall bucket, and PVC pipes are visible.
We made pitfall traps with 19.1-liter plastic buckets. To prevent desiccation of captured specimens, we placed a dampened sponge inside each trap and we re-dampened sponges each sampling day as necessary. Originally, we drilled holes into the bottom of the buckets for drainage. However, in remnants with a high ground-water level, water would flood the bucket from the bottom up. Therefore, in places that tended to flood, we installed buckets without holes in the bottom. We used iron rebar stakes to hold the buckets in the ground against hydrostatic pressure (Enge, personal communication). We scooped out the rainwater collected in pitfall traps each sampling day as necessary.
We constructed PVC pipe refugia to attract various species of tree frogs. We used pipes of both 2.5 centimeter and 5 centimeter diameter-widths, with lengths of about 76 centimeters, driving them into the ground to depths that allowed the pipes to stand up on their own (Zacharow et al. 2003). We placed one pipe of each diameter width between each wing of the Y-shaped fence array (Moseley et al. 2003), resulting in six total PVC pipes per sampling array.
Click image to enlarge
Figure 2: Illustration of edge and interior locations of herpetofaunal sampling arrays within forest remnants in Gainesville, Florida. An edge array was placed within 20 to 40 meters of the boundary of a remnant, and an interior array was situated more than 40 meters from a remnant boundary. Arrays were positioned at least 100 meters apart to maintain independence from each other.
To compare edge and interior locations (Figure 2), we considered the first 40 meters from the remnant boundary toward the interior to be "edge," and we deemed "interior" all space over 40 meters from the boundary of the remnant. We placed arrays at edge locations between 20 and 40 meters from boundary edges because of the proximity of the remnants to the urban environment and to protect against potential human interference (i.e., the public disturbing traps or trapped animals). Except for this specification, we placed sampling arrays randomly within edge and interior areas of the remnants. To assure some degree of equal sampling effort per forest remnant, we followed a one-array-per-2-hectare ratio, with a maximum of four arrays per remnant. We ensured that all arrays within the remnants were at least 100 meters apart from each other (Campbell and Christman 1982), though in two remnants, Lake Alice Conservation Area and Bivens Forest, unsuitable substrates permitted a maximum distance of only 80 meters between sampling arrays. Employing these parameters, we placed a total of seven interior and seven edge arrays in five forest remnants around the University of Florida campus.
Click image to enlarge
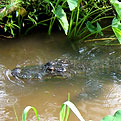
American alligator (Alligator mississippiensis) noted swimming up a stream bordering Bartram-Carr Woods.
We opened traps for periods of four days each and checked them systematically every day so that these observations coincided with the approximate time they had been set the day before. This ensured that all traps were open for the same amount of time each day (approximately 24 hours), allowing for equal sampling effort per trap. On the fourth day, we closed traps until the next sampling period. Each day, we identified the species of captured specimens and then promptly released them without marking them. We sampled herps from mid-May through early August. Arrays were open for 23 days during the summer of 2005 and for 24 days during the summer of 2006. Occasionally, flooding from heavy rains forced us to close some traps. In this event, we reopened the closed traps during the same week for the amount of sampling time lost to inclement weather. When trapped specimens were negatively affected by the presence of ants at sampling locations, we were forced to close funnel traps indefinitely.
Vegetation Sampling
To determine whether there were structural differences between the edges and interiors, we conducted vegetation sampling at randomly assigned locations in both. Due to logistical constraints, we assigned vegetation sampling points in the same manner and ratio as we had herpetofaunal sampling arrays; that is, one sample point per 2 hectares, with a maximum of four sample points per remnant. To ensure that sampling points would be contained within both edge and interior habitats, edge sampling points were located 20 meters from remnant boundaries and interior sampling points were located at least 60 meters from remnant boundaries. This system resulted in two points each for Harmonic Woods, Graham Woods, and Bartram-Carr Woods, and four points each for Lake Alice Conservation Area and Bivens Forest.
We sampled woody shrub (defined as being ≥ 1 meter in height, < 8 centimeters in diameter at breast height (DBH)) stem density on two randomly assigned, perpendicular 20-meter transects leading from the central sampling point location (James and Shugart 1970). We measured the number of trees (defined as being > 8 centimeters DBH) and standing snags in a 10-meter-radius subplot centered on the central sample point location. We scaled all the measures of shrub, tree, and snag density to densities per hectare. Following modified procedures from Tilghman (1987) and James and Shugart (1970), we randomly established four 1-square-meter subplots within 20 meters of each sample point center, and estimated several measures at each subplot. We counted woody shrub stems (≤ 8 centimeters DBH) in order to document shrubs less than 1 meter in height, and averaged counts over all four subplots. We used a spherical densiometer to measure the overstory canopy in all cardinal directions. If there was a significant mid-story (defined as < 5 meters) that prevented us from reasonably sighting the overstory canopy, then we used the location within 5 meters of the point that gave us the clearest view of the canopy. We averaged recorded measures per 1-square-meter subplot, and then per sample point.
Modifying the methods of Robel et al. (1970), we accounted for understory shrub cover by measuring the number of decimeters in each ½-meter section of a marked sighting pole (2 meters in height) that were more than 25% obstructed by vegetation. We placed the pole vertically at the center of each 1-square-meter subplot and observed to a distance of 4 meters, looking from a height of 1 meter and from each cardinal direction. We averaged data per ½-meter section of each 1-square-meter subplot, and then averaged per sample point. To account for vertical structure, we visually noted the presence of the following structural categories that were at < 1 meter in height, between 1 meter and 5 meters in height, and at ≥ 5 meters in height: grass, forbs, dead debris, shrubs (woody or herbaceous), trees (defined as plants with woody stems > 8 centimeters DBH), and vines. We visually estimated ground cover by classes representing percentages of cover (including 0%, > 0–10%, 11–25%, 26–50%, 51–75%, and > 75%) of bare ground, grass, dead debris, forbs, shrubs (woody or herbaceous), trees (woody stems > 8 centimeters DBH), and vines.
Herpetofauna Analyses
We conducted data analyses comparing the average daily relative abundance of individual species, at the order/suborder taxa level (including snake, frog, and lizard) and the family taxa level (ranids, hylids, skinks, and anoles) at both edges and interiors. We also analyzed overall species richness, comparing that of the edges to that of the interiors. We generated average daily relative abundances for each species by summing the count data for all edge and interior sampling locations of a given forest remnant (e.g., Harmonic Woods), and then dividing this by the total trap effort (i.e., number of trap days) carried out at the edge and interior locations of that remnant. Total trap effort was modified according to the sampling methodologies employed (e.g., 3 funnel traps and 1 pitfall trap = 4/4, or 100% operational) on each trap day. For example, if a total of 10 frogs were caught over 4 days in which one pitfall trap and only 2 of the 3 funnel traps were open, then we would calculate this average as: 10/(4 * [3/4]) = 3.33.
Squirrel treefrog (Hyla squirella) found in PVC pipe at Bivens Forest.
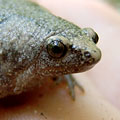
Eastern narrowmouth toad (Gastrophryne carolinensis) captured at Bivens Forest.
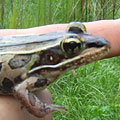
Southern leopard frog (Lithobates sphenocephalus) captured at Lake Alice Conservation Area.
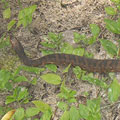
Florida banded watersnake (Nerodia fasciata pictiventris) noted at Lake Alice Conservation Area.
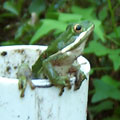
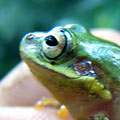
Green treefrog (Hyla cinerea) noted in PVC pipe in University of Florida forest remnant; not included in analysis.
Bronze frog (Lithobates clamitans) captured at Bivens Forest.
For most species, three funnel traps and one pitfall trap per array were the applicable sampling methodologies at each array. For hylids (tree frogs), our sampling involved only the 6 PVC pipes per array (e.g., 6 pipes = 6/6 or 100% operational). We caught brown anolis lizards (Anolis sagrei) using all sampling methods (e.g., 3 funnel traps, 1 pitfall, and 6 PVC pipes = 10/10 or 100% operational). We used this approach because our sampling effort at each array was occasionally reduced when traps or pipes were temporarily inoperable due to extreme weather or unknown disturbances (e.g., raccoon interference) or were intentionally removed due to ant predation.
In Harmonic Woods, Graham Woods, and Bartram-Carr Woods, there were only two herpetofaunal sampling arrays—one at the edge, one at the interior. Lake Alice Conservation Area and Bivens Forest were larger and therefore allowed for two sampling arrays at each edge and interior location. However, we inadvertently positioned one edge location in each of the larger remnants (at Bivens Forest and Lake Alice Conservation Area) too far from the boundaries of these remnants (that is, more than 20–40 meters from the patch boundaries). We excluded these arrays from our analysis in order to prevent undue bias on any actual difference in herpetofaunal habitat use that occurred between edges and interiors. Also, we sampled Bartram-Carr Woods only through the first week of July in 2006 because of unanticipated construction that began in that remnant.
We entered calculated data into a one-way ANOVA model blocked for forest remnant (that is, it was controlled statistically for effects contributed by individual remnants) in which average daily relative abundance was the dependent variable and edge or interior location was the independent variable. Because we were not interested in the contribution of sampling year on the variability of the data, we averaged the relative abundances for each analyzed species and group over both years. We tested the data for normality with the Ryan-Joiner test and for equal-variance with Levene's test. We attempted to use square-root transformations for non-normal and heteroskedastic distributions for individual species and groups. We used the non-parametric Friedman test to analyze species and groups that could not meet parametric test assumptions after transformation. Because there were five sampled forest remnants with both edge and interior locations, this resulted in a total of ten possible forest remnant locations. In order to prevent normality issues arising from too many zeros in the data, we statistically analyzed individual groups in each level of analysis only if they were present in at least half (5) of the ten possible forest remnant locations.
We calculated species richness at both the edge and interior for each forest remnant and entered it into a one-way ANOVA model blocked by forest remnant in which number of species was the dependant variable and edge or interior location was the independent variable (alpha = 0.1). Similar to the count data, we averaged species richness data over both years. We tested normality and variance assumptions as previously described.
In order to gauge similarities in species assemblages at edges and interiors, we computed Horn-Morisita similarity index values between edges and interiors within each remnant. To do this, we employed the R Statistical Program, using the Vegan Community Analysis package. We chose the Horn-Morisita similarity index because it incorporates both presence/absence and abundance information, and we felt it was a more complete approach to computing similarity than other indices that employ only presence/absence information.
Vegetation Analyses
We analyzed measurements of shrub, tree, and snag densities, visual obstruction in each ½-meter height section, and canopy cover with the same ANOVA model we used for the analysis of herpetofauna. Normality and equal variance assumptions were also checked in a similar manner to our herpetofauna analysis. Comparing the vertical structure of edges and interiors, we analyzed single structural categories for the vertical heights noted (< 1 meter in height, between 1 and 5 meters in height, and ≥ 5 meters in height). In a manner similar to Tilghman (1987) and Karr (1968), in order to account for dead debris, trees, and vines we calculated the proportion of occurrence, that is, the proportion of 1-square-meter subplots in which each sample variable was found, for all subplots measured within a given remnant edge or interior. This created an index of relative presence in the vertical strata between 0 and 300. For example, if trees occurred in 25% of subplots at the < 1 meter height, 50% of subplots at the level between 1 and 5 meters in height, and 100% of subplots at the > 5-meters height, the index value for the plot for trees would be: (25 + 50 + 100) = 175. Because shrubs occurred only at the lower two levels, we analyzed the presence of shrubs out of an index of 200. Because grass and forbs occurred only at the < 1-meter height level, the presence of each of these components was analyzed out of an index of 100.
Next, we analyzed total vegetation structure at each vertical height level by considering the following two variables: vegetation structure alone (only live vegetation categories) and all structure (live vegetation categories + dead debris). For vegetation structure, we calculated the proportion of 1-square-meter subplots at which a structural category occurred at a given height level to create an index between 0 and 500 at the < 1-meter height level (all vegetation components); between 0 and 300 at the level between 1 and 5 meters in height (shrubs, trees, and vines); and between 0 and 200 at the > 5-meters height level (only trees and vines). We analyzed total structure (live vegetation categories + dead debris) at each height level in a similar way, but we calculated the relative structure out of an index between 0 and 600 at the < 1-meter height level, between 0 and 400 at the level between 1 and 5 meters in height, and between 0 and 300 at the > 5-meters height level because of the addition of dead debris. We analyzed the calculated index values for each category with the same ANOVA model we used in the herpetofaunal analyses, and we checked normality and equal variance assumptions in a similar manner to that used in the analysis of herpetofauna.
To analyze ground cover, we separately compared each cover class (0%, > 0–10%, 11–25%, 26–50%, 51–75%, and > 75%) of each ground cover variable (bare ground, grass, dead debris, forbs, shrubs, trees and vines) at edges and interiors. As a singular example, for dead debris we compared the 50–75% cover class between remnant edges and interiors. To do this, we calculated the proportion of occurrence (i.e., how many 1-square-meter subplots a cover class occurred in) of each cover class per cover variable over the four 1-square-meter subplots at each sample point location. We then calculated the average per remnant edge and interior. Due to an inconsistency in data collection, we were unable to analyze the > 0–10% and > 10–25% cover classes for ground cover variables. We entered the remaining data into the same ANOVA model previously described. For all statistical tests, we checked normality and equal variance assumptions as described above, and we tested non-normal distributions unaffected by square-root or log transformation with the non-parametric Friedman test. We used an alpha = 0.1 for all statistical tests.
Results
Over the summers of 2005 and 2006, we checked 12 arrays on a total of 552.5 trapping days for tree frogs, 548.6 trapping days for brown anoles (Anolis sagrei), and 542.75 trapping days for all remaining species. We caught a total of 24 species in all arrays and detected an additional 7 species outside of the arrays (Appendix I). We did not include the species we detected outside of arrays in our analyses.
Individual Species
Only six species were present in enough forest remnant locations for both years to be analyzed individually. After analyzing the occurrences of brown anole (Anolis sagrei), greenhouse frog (Eleutherodactylus planirostris), green treefrog (Hyla cinerea), squirrel treefrog (Hyla squirella), bronze frog (Lithobates clamitans), and common ground skink (Scincella lateralis), we found that no species had significantly higher relative abundances at either edge or interior locations (Table 1).
Order and Family Subgroups
In order-level subgroups, including the order Anura (frogs) and the suborders Serpentes (snakes) and Lacertilia (lizards) of the order Squamata (scaled reptiles), we found that none of the groups showed significantly higher relative abundance at edges or interiors (Table 1). Among family-level subgroups, including the families Ranidae (true frogs), Hylidae (tree frogs), Scincidae (skinks), and Polychrotidae (anolis lizards), no group revealed significantly higher daily relative abundance at edges versus interiors (Table 1).
Species Richness and Composition
The number of species we analyzed at edge and interior locations was not significantly different (Table 1). The Horn similarity index, which we used to compare species compositional similarity between edges and interiors, is based on a scale of 0 to 1, with 0 representing a completely different species composition and 1 representing completely identical compositions. When we calculated the similarities between the edges and interiors of individual remnants, we found that similarity values ranged from 0.520 to 0.890, with a mean value of 0.775 (Table 2). This indicates that herpetofaunal species assemblages were highly similar at the edges and interiors of all the remnants we considered, with the exception of Lake Alice Conservation Area. Lake Alice Conservation Area, with a Horn Similarity Value of 0.520, had only a moderately similar species assemblage at its edge and interior.
Vegetation
Our analysis of average shrub stem density ( < 1 m and ≥ 1 m in height), canopy cover, visual obstruction, vertical vegetative structure, and density of trees and snags showed no significant differences in the vegetation characteristics of the edge and interior areas. When we compared ground cover, we found a significantly greater occurrence of vines in interior locations—making up between 25 and 50% of the ground cover there—as compared to at edge locations (d.f. = 1, F = 7.08, P = 0.056). All other tests were not significant (P > 0.1).
Discussion
We found no difference in herpetofaunal use of edge or interior habitat for any individual species, family-level taxa group, or order-level taxa group. We also found no difference in species richness between edges and interiors. Further, our species composition similarity index values at edges and interiors ranged from moderately similar to highly similar, which indicates that the assemblage of herpetofaunal species at the edges and interiors of most remnants was largely the same. Therefore, from 20 meters up to approximately 100 meters from the edge, the herpetofauna analyzed in our study do not appear to use the edges or interiors of these small urban remnants differently.
One possible reason for the herps' lack of discrimination in these remnants could be the small amount of structural habitat differences found between the edge and interior habitats in this study, particularly in terms of variables such as canopy cover. In previous research of edge versus interior habitat segregation by herpetofauna in forest fragments, canopy cover has tended to be denser at interior locations (Schlaepfer and Gavin 2001; Urbina-Cardona et al. 2006). Denser canopy cover was directly related to higher relative humidity at interiors by Urbina-Cardona et al. (2006), and was implied to have contributed to lower temperatures and higher humidity at interiors by Schlaepfer and Gavin (2001) and Lehtinen et al. (2003). These interior conditions partially drove the segregation of edge and interior habitat by some species of herpetofauna in these studies, at least on a seasonal basis. In addition, understory vegetation cover being denser at edges than interiors may also have contributed to habitat segregation in the study by Schlaepfer and Gavin (2001). The lack of such vegetative differences during the summer in our study suggests that these forest remnants are relatively homogenous up to 100 meters from the remnant boundary, and therefore may have contributed to the lack of significant difference in use of edge and interior habitats by herpetofauna.
Moreover, we sampled the herpetofauna in our study only during the summer rainy season, and species during this season, particularly amphibians, may have been inclined to use the entire forest remnant if they were dispersing in search of wetlands for breeding activities. This assertion is consistent with Lehtinen et al. (2003), who found that several species of frogs and reptiles were significant edge habitat avoiders during the dry season in isolated tropical forest patches in Madagascar, while most species of frogs and some species of reptiles were either edge-indifferent or interior-avoiding during the wet season. Lehtinen et al. (2003) reasoned that moisture-sensitive herpetofauna would be more willing to disperse to warmer edge habitats during the wet breeding season, whereas these species preferred the cooler, moister conditions offered by forest interiors during the dry season. Further, the study by Lehtinen et al. (2003) was conducted within forest remnants surrounded by a "hard" matrix of desert-like "sand-scrub" that may have been functionally similar to the urban matrix of buildings and roads surrounding several of the remnants in our study. These results indicate the need for additional research during both the wet and dry seasons in urban remnants.
Also, in our study only six species were sufficiently common to be analyzed individually. Our sampling methodology may not have been effective in capturing other species, particularly species that are largely fossorial, such as the Eastern glass lizard (Ophisaurus ventralis), or aquatic, like two-toed amphiuma (Amphiuma means). Other species of herpetofauna common to the Gainesville area simply may not be abundant in these urban remnants due to habitat isolation. Of the species we analyzed, none are overly rare in Florida, and two of them, brown anoles (Anolis sagrei) and greenhouse frogs (Eleutherodactylus planirostris), are introduced species and are often associated with disturbed areas. Given the lack of difference in vegetation at edges and interiors, it is therefore not unexpected that these species showed no differentiation in habitat use.
Lastly, the lack of a significant difference in habitat use of herpetofauna between edge and interior habitats may have been influenced by our method of determining edge and interior spaces. Because we considered the threat of trap disturbance by humans significant in this group of remnants, we determined it was necessary to place traps at edge locations at least 20 meters from patch boundaries. In previous studies comparing herpetofaunal habitat use of remnant edges and interiors, edge effects have been detected only a few meters (Lehtinen et al. 2003; Schlaepfer and Gavin 2001) and up to 20 meters from remnant borders (Urbina-Cardona et al. 2006). In our study, we did not account for potential variability in herpetofaunal use and compositional similarity for fewer than 20 meters from remnant boundaries, and we did not directly consider vegetation characteristics fewer than 20 meters from remnant boundaries. Perhaps the first 20 meters of the urban forest edge may demonstrate different herpetofaunal abundance, composition, and richness than interior locations. Future research should study this 0 to 20 meter range, but only in urban remnants where potential human disturbance of traps is minimal.
Despite the lack of an apparent difference in edge and interior habitat use in this study, the results reveal that urban forest remnants are used by a number of different herpetofaunal species. Although only six species were included in individual analysis here, a total of 31 species were noted over the course of two field seasons in these remnants, including seven species that were not caught in sampling arrays but were observed coincidentally during the sampling seasons (Appendix I).
Edge locations in urban remnants can provide herpetofauna access to habitat with high exposure to sunlight in the adjacent matrix, if not at edges themselves. It should be noted, however, that the presence of herpetofauna within these remnants is not necessarily an indicator of habitat quality. (For example, we did not determine whether or not these remnants serve as population sources or sinks.) The conservation of amphibians and reptiles in urban forests contributes toward the diversity of the surrounding urban environment, but studies are lacking in the literature. More research should be conducted on how herpetofauna use urban habitats.