
PUBLISHED: DECEMBER 2005
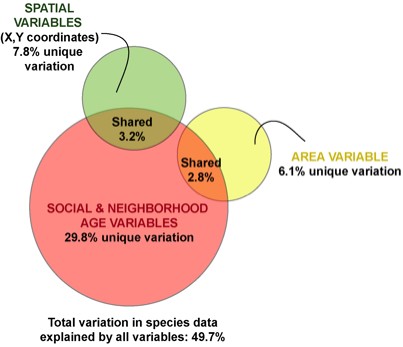
Figure 4: Variance decomposition based on partial redundancy analyses of the bird community in Greater Vancouver, BC. Pink represents variance explained by social and neighborhood-age variables, after removing the effects of covariates area and space (XY coordinates). Yellow represents variance explained by census tract area alone, after removing the effects of the space covariate and social + neighborhood-age variables. Green represents variance explained by space alone, after removing the effects of the area covariate and social + neighborhood-age variables. Amounts of shared variance were calculated by running a further series of partial redundancy analyses and calculating the joint or shared effects of 1) social + neighborhood-age variables, constrained by area, 2) social + neighborhood-age variables constrained by space, and 3) area, constrained by space.