Evaluating Restoration Success in Urban Forest Plantings in Hamilton, New Zealand
by D. Bruce MacKay1, Priscilla M. Wehi1,2, and Bruce D. Clarkson1
1 Department of Biological Sciences, University of Waikato, Private Bag 3105, Hamilton 3240, New Zealand
2 Address correspondence to B.D. Clarkson, email [email protected]
Abstract
To evaluate the success of restoration efforts in young urban plantings, we assessed 66 experimental plots in gully systems in Hamilton City, New Zealand, and adjacent areas. We compared vegetation change in restored patches planted with native species to vegetation in naturally regenerating patches and mature native forest. A range of variables was used to assess ecosystem functional, structural, and compositional attributes. Different planting and maintenance regimes and environmental factors likely to affect the success of plantings were also evaluated. Vegetation change towards the mature forest reference state was found to be rapid in twenty plots. However, twelve plots showed limited progress towards this state, with low numbers of lianas and epiphytes and low native species recruitment, regeneration, and species diversity.
Management treatments found to be beneficial for a plot's ecological condition included good-quality maintenance and a low level of human disturbance. Diverse planting and enrichment planting (addition of species after initial planting) were more beneficial if they were linked to good maintenance. Proximity of seed sources was important for good ecological condition. The research supports the concept of multiple restoration pathways but not the idea of a closely defined assembly order (deterministic sequence) for the vegetation community. The findings suggest that restoration in isolated urban patches requires species enrichment within, or peripheral plantings near, patches. The regeneration and dispersal functions appear to be more important for successful restoration than composition on site. Human disturbance should be actively managed to maximize restoration success.
Keywords: enrichment planting, restoration, regeneration, succession, urban, vegetation composition, management
Introduction
It is now recognized that many threatened ecosystems exist within cities, and they are a high priority for restoration despite their often degraded condition (e.g., Clarkson et al. 2007). Yet urban environments often create intractable problems for sustaining indigenous ecosystems. High levels of disturbance, habitat destruction, and isolation or modification of remnant ecosystems all complicate restoration efforts in urban environments and alter successional processes and species composition (Douglas 1983; Heywood 1996; Hobbs and Norton 1996; Jenks et al. 1996). Consequently, ongoing maintenance may be required (Parker and Pickett 1997; Webb 1997). Understanding disturbance, which is common in the urban environment, is fundamental, as modified relief, hydrology, and soil quality all contribute to site degradation. In these ecosystems, therefore, restoration can be seen as both an attempt to halt degradation (Aronson et al. 1993) and a process that manages succession and attempts to reestablish functioning and self-sustaining dynamic systems (Parker and Pickett 1997).
Restoration to pre-disturbance ecosystems is often not a realistic goal. Since the relationship between ecosystem structure, function, and composition is not well understood, even with all pre-disturbance species present, it may be impossible to reassemble communities (Luh and Pimm 1993). Factors such as seed dispersal, competition, and exotic species invasion may threaten the success of ecological restoration and influence the successional pathway or trajectory of ecosystems (Ashby 1987).
Instead, the available species pool may provide for multiple alternative stable states (Parker and Pickett 1997; Hobbs and Harris 2001; Temperton et al. 2004). Key features frequently measured to assess restoration success include species richness, diversity, and composition, and forest structure. Physical characteristics such as decomposition, soil structure, ground cover (indicating invertebrate habitat values), and habitat development also illustrate aspects of the ecological community's functional processes. We would expect forest structural diversity, development of understory layers, and increasing numbers of epiphytes and lianas to occur with increasing age and development of a plot, and basal areas and biomass (indicative of plot productivity) to generally increase with diversity.
The urban and periurban areas of Hamilton, a small city on the North Island of New Zealand, are some of the most modified in New Zealand, with remnant native vegetation currently at 0.1% of that present in 1840 (Leathwick et al. 1995). Remnant vegetation survives in isolated gullies, wetlands, and fragments of lowland bush. A movement to restore these remnants is gaining momentum. In 2003, some 187 hectares of land within the city boundaries were under restoration in some form, including 142 hectares of public land (Clarkson and McQueen 2004). The Hamilton city council has been planting gullies intermittently since about 1975 (Hamilton city council internal unpublished plan records) and now plants over 50,000 native plants annually in restoration projects (W. Bleaken, nursery foreman, Hamilton city council, personal communication 2005).
However, revegetation project goals have not always been clear. Several methods have been used to increase revegetation success. Survival and persistence of the city's plantings have been mixed, with some early total failures and high rates of loss. Questions have arisen over the efficacy of different approaches to restoration planting composition, site preparation, post-planting maintenance, and long-term diversity enhancement. The value of species for restoration must be evaluated based on their ability to survive and reproduce, create suitable conditions for other species on the site, or induce vegetation changes desirable for restoration. Management techniques to manipulate environmental conditions can be used to direct vegetation change (Luken 1990). Such techniques include mulching and spraying for moisture and weed control, cultivating soil, modifying germination conditions, and controlling species competition and persistence (Gross 1987; Simcock and Ross 1997).
A frequent goal of restoration is to produce an ecosystem that is similar in function, structure, and composition to nearby undisturbed reference ecosystems. This study provides a first assessment of attempts to restore indigenous vegetation communities in Hamilton city gullies by examining plantings from the last 30 years by both private individuals and the city council. We investigated whether different levels of enrichment, human disturbance, and maintenance affected restoration outcomes for these plantings in terms of species richness, diversity, composition, forest structure, productivity, regeneration, and propagule dispersal relative to natural succession in undisturbed forest communities. We compared these outcomes to a set of local indigenous reference communities that are relatively undisturbed.
Methods
Geographical area
The investigation was carried out in Hamilton, New Zealand. Hamilton is an inland city of 9,427 hectares with a population of 156,000 (Statistics New Zealand: www.stats.govt.nz/). It extends from latitude 37°31′ S to 38°03′ S and longitude 175°05′ E to 175°33′ E (Figure 1). It has a temperate, humid climate with a mean annual rainfall of around 1190 millimeters, and a mean annual temperature of 13.7°C (about 57°F). The gullies that are a feature of Hamilton topography, and now a focus of urban restoration efforts, result from gradual erosion of tephra and alluvial deposits. They typically have steep, highly erodable sides with well-drained soils of rhyolitic sands and gravels, and flat gully bottoms with poorly drained soils (McCraw 1967; Selby and Lowe 1992).
Plot Locations and Site Selection
Between November 2003 and July 2004, we selected 66 plots in 15 treatments with replicate plots (as indicated in Table 1) in urban plantings (49) and adjoining wildland control sites (13) and reference native forests (4). All sites were located in Hamilton city gullies or the wider Hamilton Ecological District. Initial assessment of sites used a stratified sampling technique (Eberhardt and Thomas 1991) that considered estimated age of planting (confirmed during survey by tree coring or from extant planting plans), maintenance regimes or treatments, initial cover type (canopy cover vs. open), planting treatments (enrichment planting vs. absence of it), type of site (control vs. planted), main aspect, and preliminary condition assessment (visual correspondence with natural forest). All sites were selected with gully mid-slope as the locus for plot placement, and experiment design was adjusted to suit the available sites. This resulted in 17 control plots (including the 4 reference sites) and 49 planted plots (Table 1). Control plots included baseline sites of natural regeneration and mature native forest, located both in urban locations similar to the planted sites and in some more remote locations. Control sites covered a range of vegetation types.
Plot sampling
The plots were first divided by age and maintenance regime (high or low), with four plots in a mature forest control group. Within the high maintenance treatment level, 8 groups were 'nested'. Thus, the 0- to 10-year-old, high-maintenance treatment plots were divided according to canopy, or lack of it, at planting. Differences in initial diversity and enrichment planting divided the 10- to 20-year-old high-level maintenance treatment plots into four combinations, and the 20- to 30-year-old high-level maintenance treatment plots into two combinations (enriched and unenriched). Initial planting diversity and level of planting enrichment for selected plots was assessed both visually and from city council plans. Plots were classed as either initially diverse (> 10 species) or depauperate (≤ 10 species) and enriched (> 4 species) or unenriched (≤ 4 species). Controls for each age range acted as zero-maintenance treatments. The no-canopy treatment and unenriched and initially depauperate planting were also used as secondary controls for each of the nested treatments. In addition, the main 'reference' community used to compare progress or success in planted sites was the oldest and most mature forest control block.
Field Method
Plot information was recorded using the variable area plot method (Jane 1982; Batcheler and Craib 1985), which requires measuring 30 canopy tree stems in a spiral sequence from the center of the plot (> 2 centimeters diameter breast height (dbh); > 2 meters tall). The technique was modified to reduce the effects of small patch size, so plot stem counts stopped at patch edges if encountered, and then continued on reentry to the patch until the required stem count was achieved. The plot radius was the average distance (measured in two directions at right angles) to stems furthermost from the plot center. The plot center was a randomly selected point at least 15 meters from the edge of a patch. A diameter line through the area available for locating the plot was established with a random bearing derived from a 1–100 random number chart combined with 100th divisions of the compass. The approximate center of the selected patch and its diameter were then established.
The ecological state of revegetation patches was derived from each plot's data for species richness, diversity, and composition; forest structure; productivity (biomass); regeneration; and propagule dispersal distances. Stand age was estimated by evaluating increment cores from up to 3 trees in each plot (Stokes and Smiley 1968; Norton et al. 1987). Species of plants present in all layers (canopy, subcanopy, saplings, seedlings, ferns, lianas and epiphytes, and groundcover) were recorded, along with species numbers in each height and dbh class. We recorded proximity to nearest possible seed sources for recorded indigenous propagules. We visually graded maintenance levels and human disturbance on a 0–3 scale. Human disturbance was defined as evidence of vandalism, tracking, and other ad hoc activities. Maintenance was defined as evidence of pruning, thinning, removal of dead wood, and weed control (spraying).
At each selected site, four randomly located small seedling subplots were established within the main plot, with another placed at the center, to determine seedling regeneration from count data. Two transects for the 'point intercept' measurement of groundcover were placed through each plot, one directly up the slope and the other at approximately 90o to the slope. Groundcover type was recorded at 1-meter intervals along each transect in the classes ferns, moss, other vegetation, roots, soil, dead wood, and rubbish. Other recorded data included average plot diameter and environmental measurements such as aspect, slope, soil moisture (or drainage, assessed on a seven-point scale) and soil sand composition (texture, assessed as percentage of sand).
Species richness was assessed using the number of species present and species alpha diversity. Other measures were the number of species in each canopy-to-seedling layer (canopy, subcanopy, saplings, seedlings, ferns, lianas and epiphytes, and groundcover layers); the number of liana and epiphyte species, with native and exotic subsets; and specific composition of native species. All native vascular species typical of the control plots, with means greater than 0.3 individuals per block, were tabulated. Mean canopy heights were assessed for all plots by summing cumulative heights and dividing by the total number of canopy individuals. Density was recorded as stems per 100 meters2 in eight diameter classes, and total relative density was calculated. Canopy, subcanopy, sapling, seedling, young fern, and groundcover data were combined to determine the number of structural tiers. Unplanted species up to 2 meters in height were assessed to determine the number of regeneration classes. Basal area (centimeters2 per 100 meters2) was used to calculate mean productivity for each block. Total counts of regenerating plants in five subplots in each plot, naturally regenerating species in the whole plot, proportion of canopy species estimated as regenerating species, and estimated average proximity to a seed source for recorded species were used to assess regeneration and dispersal. For each measure, the relative proportions of native and exotic species were also recorded.
Data Analysis
Preliminary descriptive tests for normality (Shapiro-Wilk W test) showed that most data variables were generally not normally distributed, nor were the variances homogenous (Levene's or Brown-Forsythe tests). Non-parametric Kruskal-Wallace ANOVA tests were used to compare multiple samples (block or cluster groups). These tests analyze variance for each continuous (predictor) variable and test the null hypothesis that the different blocks or clusters in the comparison were drawn from the same distribution or from distributions with the same median. Multivariate ordination using PCA and classification using dendrogram cluster analysis with non-normal data cannot use parametric Pearson correlation (to assess the correlations between variables in the data) (Quinn and Keough 2002). However, the Spearman correlation is appropriate since it can use data without a normal distribution, though the data must be in at least ordinal form. It is also viewed as having a wider validity (Altman 1991). Accordingly, Spearman rank order correlations and Spearman correlation matrices were developed to assess correlations between a number of variables. Data were analyzed using Statistica 7 from Statsoft.
Click images to enlarge
(a)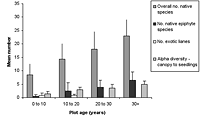
(b)
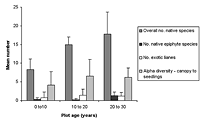
Figure 1. Differences in species richness characteristics in (a) natural succession (control) and (b) low-maintenance plots aged from young (0–10 years) to old (30+ years). Mean ± SD is shown for each measured variable.
Results
Physical characteristics
Maintenance, age, and disturbance were highly significant in explaining differences between treatment blocks; other physical characteristics were relatively unimportant. Planted plots had a lower average age than their equivalent control plots, but there were no strong patterns with aspect, soil moisture, soil sand content, or dead wood, moss, and bare soil intercepts. Blocks with initially diverse but unenriched plantings had ground litter intercepts (13.8 ± 8.1) that were most similar to those of mature forest (13.2 ± 3.3, Kruskal-Wallis ANOVA, p < 0.05). Twenty- to thirty-year plots and 10- to 20-year plots with initially diverse and enriched plantings also had values in the range of the mature forest control.
Human disturbance differed significantly in the experimental blocks (Kruskal-Wallis ANOVA, p < 0.0001), and was highest in blocks with diverse, unenriched initial planting. Disturbance was positively correlated with maintenance and negatively correlated with slope (Spearman rank correlations, p < 0.05, Table 2). Maintenance was highest in planted blocks where initial planting was both diverse and enriched.
Species Richness, Diversity, and Composition
Click images to enlarge
(a)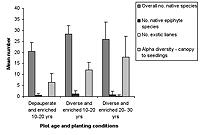
(b)
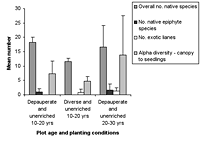
Figure 2. Species richness characteristics in high-maintenance plots with (a) enriched plots with initially diverse and depauperate planting and (b) unenriched plots with initially diverse and depauperate planting, at 10–20 years and 20–30 years. Mean ± SD is shown for each measured variable.
Over all plots, 141 live vascular indigenous taxa and 112 live vascular exotic taxa were recorded (Appendix A). The 10 most common vascular species are all natives, although none of these species was recorded in every plot (Appendices B and C). Native species richness variables increased with age in control blocks (Figure 1), while exotic species richness decreased with age. Alpha diversity for canopy to seedling species increased gradually across the controls with increasing age (Figure 1). However, the overall number of native species, number of native lianas and epiphytes, and alpha diversity of canopy to seedling plants all varied significantly across differently aged planted blocks, and with different treatments (Kruskal-Wallis ANOVA, p < 0.01 in all cases, Figures 1b and 2). Blocks aged more than 10 years with a high level of maintenance and enriched plantings had numbers of native species most similar to those of mature forest (Figure 2a). In planted blocks, the overall numbers of native species were initially (0- to 10-year-old blocks) similar to the controls (Figures 1 and 2). Values increased generally with age, but some values in 20- to 30-year-old blocks decreased compared to younger, high-maintenance blocks. Values increased with enrichment and decreased with higher diversity in unenriched blocks (Figure 2).
Overall numbers of native lianas were similarly low across planted blocks. Although the number of native lianas and epiphytes generally increased with age, there were no clear effects related to enrichment, diversity, or canopy at planting. The overall number of exotic species was similar across experimental blocks, the exception being the number of exotic lianas which increased with age in planted blocks (Kruskal-Wallis ANOVA, p < 0.05, Figure 2). Alpha diversity values for regenerating plants were most similar to mature forest in blocks aged more than 10 years, with particularly high values for high-maintenance plots.
Click images to enlarge
(a)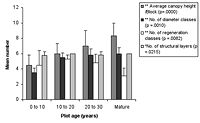
(b)
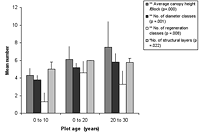
Figure 3. Forest structure variables in (a) control and (b) low-maintenance plots of different ages. Significant differences between age classes are indicated by * p < 0.05, and ** p < 0.01. Mean ± SD is shown for each measured variable.
Compositionally, component species and their changing relative dominance consistently progressed from younger to older blocks (Appendix B). There were, nonetheless, no clear relationships between species composition and maintenance, diversity, enrichment, or canopy. Most planted blocks had more late-control species present than did their control counterparts of similar age, with taxa such as ferns represented in low numbers.
Forest Structure
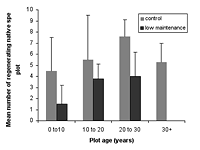
The number of diameter classes varied significantly between planted block means (Kruskal-Wallis ANOVA, p < 0.01) and increased with age in control plots, as well as modestly increasing with maintenance in planted blocks (Figures 3 and 4). Initial density values (0–10 years) varied considerably in planted blocks. Density was significantly correlated with other structural diversity measures (Spearman rank correlations, p < 0.05, Table 2). The density of seedlings from canopy individuals and regeneration class number varied significantly between means for planted blocks (Kruskal-Wallis ANOVA, p < 0.01) and decreased with age. Regeneration class values peaked at 10–20 years in the planted blocks, and values increased with enrichment (Figure 4).
The number of structural layers similarly varied significantly between planted block means (Kruskal-Wallis ANOVA, p < 0.05, Figure 4), with 10- to 20-year-old plots and mature forest plots having similar values. There was a modest increase in values with enrichment and diversity of planting. The number of structural layers tended to decline at the 20–30 year period in all blocks.
Click images to enlarge
(a)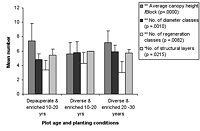
(b)
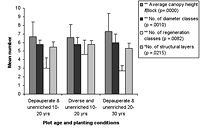
Figure 4. Forest structure variables in high-maintenance plots of different ages that are (a) enriched and (b) unenriched with either diverse or depauperate initial planting. Significant differences between age classes are indicated by * p < 0.05, and ** p < 0.01. Means ± SD are shown.
Productivity
Mean basal area varied significantly between the experimental blocks (Kruskal-Wallis ANOVA, p < 0.05). In the control blocks, basal area increased with age, and few planted blocks had values similar to the controls. Mean basal area values increased with enrichment, age, and maintenance (Kruskal-Wallis ANOVA, p < 0.05 for all), and mean basal area values in initially diverse and enriched plots were most similar to mature forest values. Biomass did not differ significantly between experimental blocks.
Regeneration and Dispersal
The number of regenerating native species differed significantly between the planted block means (Kruskal-Wallis ANOVA, p < 0.01) but there was no difference in the number of regenerating exotic species or in the regenerating native plants count. The number of regenerating species was generally low in planted blocks in comparison with the controls in the initial age group (0–10 years, Figure 5). However, at 10–20 years a boost in species occurred, followed by a decrease after year 20 in some blocks. In control blocks, the number of regenerating native species decreased with maturity (Kruskal-Wallis ANOVA, p < 0.02). High-maintenance plots with enrichment had values in the range of mature plots, as did high-maintenance, unenriched, but less species rich plots. In planted blocks, the average distances to seed sources decreased significantly with increased age (Kruskal-Wallis ANOVA, p < 0.01), although average estimated distances to seed sources were less than 65 meters. Average distance to seed source in control plots was greatest in plots aged 10–20 years.
Ecological state of restoration plots
Overall ecological state of planted plots was assessed by comparing the examined variables across planted and control plots. Overall condition of planted plots improved with age, apart from low-maintenance, 20- to 30-year-old plots and high-maintenance plots with initially diverse, unenriched planting. Some planted blocks, such as enriched 10- to 20-year-old plots, had variables at least equal to those of equivalent-aged controls. These same blocks also had values for two or more variables in the same range as the mature forest plots. Other plots, however, showed deterioration over time.
Discussion
Our data show that the urban restoration plots we assessed are moving towards a reference ecosystem state over time. However, their levels of ecological condition did not match the levels of equivalent-aged control sites or mature forest control sites in all of the most significant variables. The data therefore support the likelihood of multiple developmental pathways, with, for example, clear differences between planted and control plots in the number of lianas and epiphytes. As well, sites deteriorating in ecological condition had low native-species recruitment, high exotic recruitment, and low regeneration diversity. In these blocks, maintenance levels were also lower than in blocks with healthy ecological condition.
Ecological restoration often requires initial eradication of exotic species, as these are frequently prevalent in small, isolated remnant patches (Andrén 1994; Miller 2002). This is particularly true at sites with high levels of continued external disturbances, such as widespread dispersal of exotic seed, or recreational use (Pickett et al. 2001; Vidra and Shear 2008). In the blocks with deteriorating condition, human disturbance was higher than in older planted blocks that were in better condition. Our findings indicate that high maintenance of restored sites (including weed control) was strongly associated with good ecological condition, and this was especially evident at older (> 10-year) sites. High maintenance was associated with poor condition at some young sites (< 10 years), and at those planted with a more diverse range of species. These sites also had shallow slopes relative to other blocks, and we suggest that at these sites, the positive effects of high maintenance may be offset by the negative effects of high human disturbance. Overall, our data confirm Luken's (1990) view that control of human disturbance may be vital to restoration success.
Sites with higher initial planting diversity were associated with poorer ecological condition in functional attributes such as litter, diversity, and regeneration classes. However, they were also associated with better ecological condition in structural and species-richness attributes, such as overall number of native species, number of structural layers, and number of regenerating native species. Planting diversity thus appears affected by both maintenance and disturbance. Species enrichment appeared to be generally beneficial, with more positive effects in blocks with higher initial diversity. Enrichment appeared to benefit urban plantings, especially those with good maintenance and low disturbance.
Overall, the high number of native species in 0- to 10-year-old sites was similar to that in control sites. This is most likely explained by initial planting densities and attrition. Restoration patches planted by Hamilton city council typically included up to 20 species. However, selected plan records (unpublished) compared with species recorded on site showed that surviving species were typically less than 60% of the species originally planned for planting. This attrition may be followed by increased recruitment to the gaps left (for example, resulting in density increases in 10- to 20-year-old blocks). High attrition may also allow exotic species that prefer high light to establish, such as the invasive weed Tradescantia fluminensis, which frequently dominates degraded lowland forest remnants (Kelly and Skipworth 1984), in turn reducing native seedling survival as biomass increases (Standish et al. 2001). Selection of species suited to a pioneering role may be critical to future survival, as is species suitability for site locations.
The decline of native species numbers in a small number of high-maintenance plots, and lack of native lianas and epiphytes across all planted sites, may relate to proximity of exotic or native species seed sources that are likely to be critical to establishment and ongoing recruitment (e.g., Kostel-Hughes et al. 1998; Jacquemyn et al. 2003; Sullivan et al. 2005). Greater alpha diversity values in planted blocks may have resulted from a combination of the (non-local) range of species planted and the local volunteer species producing a larger than expected species diversity. Values were even greater with some enrichment plantings, where this effect was likely to have been present. This research shows that it is possible to achieve substantial gains in restoration despite not all species being present, in contrast to some other studies (e.g., Luh and Pimm 1993).
Finally, the emphasis of ecological restoration is on the recovery or construction of functional communities. Assessment of species composition changes at different-aged sites can therefore provide information about how communities are constructed. Our data show that overall species composition was not a good predictor of ecological state, but that changes in species composition at different-aged sites appeared to correspond to functional group changes. Reay and Norton (1999) similarly found that forest plant species at three different-aged native forest restoration sites became compositionally more like naturally regenerating and mature sites with increasing age, in their study in the eastern South Island, New Zealand. However, nine species that occurred in older late-control sites were rare at planted sites.
Our analyses suggest that management measures such as maintenance and enrichment have only a limited effect on compositional authenticity.
The higher number of diameter classes found in planted blocks may have resulted from relatively lower densities occurring at 0- to 10-year-old sites and the use of relatively large plants for planting or the presence of existing trees, promoting a wider range of diameters. Where this forest structure is undesirable, enrichment could counteract this trend, as perhaps found in some of the plots assessed here. The number of structural layers in plots appears related to both initial planting diversity and maintenance. The decline in structural layers in the 20- to 30-year period in all planted blocks echoed a similar trend in the controls; self-thinning is one possible explanation here. Planting density may also have important repercussions for later forest structure and complexity. Low maintenance seemed to influence the densities of unmaintained blocks, as these were close to their relative control levels. However, 10- to 20-year-old high-maintenance blocks showed a progression of density with age, with the highest density in the youngest block. The generally lower basal areas for the planted blocks compared to control sites could be explained by their higher relative density.
Our research demonstrates that native species were not recruiting to restoration plots as well as in the controls, and regeneration diversity in planted plots was generally below controls. Further, there was ongoing recruitment of some exotic species even 20–30 years after establishment. These regeneration results, when considered with exotic species numbers in older blocks and the low level of native lianas and epiphytes and of native species discussed above, suggest that competing exotic and native species recruitment is occurring. These findings are consistent with previous research that has demonstrated that seed rain and the seed bank are both important for plant recruitment (e.g., Bakker and Berendse 1999; Wang and Smith 2002). Further investigation of both seed source proximity and species present in the seed bank will help tease out these results.
Conclusions
In this study, the ecological condition of planted plots improved with age, but none were as advanced as equivalent-aged control plots or the mature forest control in all of the most significant variables. Advanced species diversity, structural diversity, and dispersal processes (indicated by the presence of lianas and epiphytes and regeneration) were the areas of poorest performance in restoration plots. Overall species composition did not appear to be a good predictor of ecological state. Instead, overall ecological state of the plots can be explained by a number of critical factors, including recruitment and regeneration, species composition, maintenance and disturbance.
Regeneration was not generally functioning as well in planted plots, probably due to lack of close seed sources and vulnerability to exotic invasion under these conditions. Initial planting diversity was often compromised by species losses, so plant survival in the first 10 years is an important objective. This in turn may indicate that attention to site location and species selection is critical. Generally, enrichment planting combined with diverse initial planting resulted in better ecological condition. High-quality maintenance resulted in less loss of initial species diversity and better survival of enrichment plantings.
Maintenance was generally beneficial for restoration in planted plots. High maintenance had most value for control of exotic species and enrichment for diversity enhancement, and was particularly valuable in older restoration, provided it was linked to lower overall disturbance. Limiting the impact of tracking and other forms of disturbance by controlling public access may improve success in restoration plantings.
Acknowledgments
Heather Blackwell, Robert MacKay, and Russell Armitage assisted with data collection in the field. Ray Littler provided statistical assistance. We thank Hamilton city council staff and private landowners who permitted access to survey sites. This research was partially funded by FRST contract UOWX0501 at the University of Waikato.

