PUBLISHED: MAY 2008

Increasing Interactions with Nature: A Survey of Expectations on a University Campus

Figure 5c

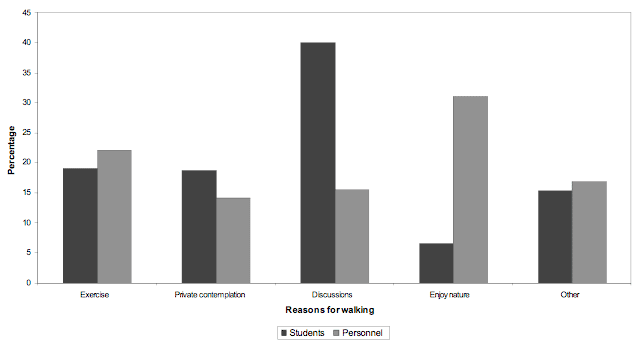
Figure 5c: Graph representing as a percentage the reasons why respondents take walks on campus. A significant difference exists between the reasons of students and those of personnel for walking on campus (Χ<sup>2</sup> = 92.81, df =4, p < 0.05). Apart from walking to class and back, students walk on campus mainly while having discussions with friends or other students, while the smallest group walk to enjoy nature (Χ<sup>2</sup> = 213.27, df =4, p < 0.05). Personnel, on the other hand, mainly walk on campus in order to enjoy nature and are the least likely to walk while taking time for private contemplation (Χ<sup>2</sup> = 14.70, df =4, p < 0.05).

Figure 5c: Graph representing as a percentage the reasons why respondents take walks on campus. A significant difference exists between the reasons of students and those of personnel for walking on campus (Χ2 = 92.81, df =4, p < 0.05). Apart from walking to class and back, students walk on campus mainly while having discussions with friends or other students, while the smallest group walk to enjoy nature (Χ2 = 213.27, df =4, p < 0.05). Personnel, on the other hand, mainly walk on campus in order to enjoy nature and are the least likely to walk while taking time for private contemplation (Χ2 = 14.70, df =4, p < 0.05).